
In a previous article, we learned about supervised learning: using labeled examples for creating models that solve a variety of tasks such as classification and regression.
There is another type of learning that doesn't require labeled examples: unsupervised learning. As it turns out, unlabeled data is much more common than labeled data. Often, you need to create the labels for the examples yourself, a process that might consume vast amounts of time and resources.
That's ok, lack of labels doesn't mean your data is totally useless. There are lots of machine learning tasks that do not require labeled examples, and you can use unsupervised learning to perform data exploration or to extract useful insights from the data that is readily available right now.
In this article, we will discuss some of the most common applications of unsupervised learning. Let's learn how to use unlabeled data to achieve valuable results.
1. Association rule learning
Association rule learning/mining is a method for discovering relations between elements in large datasets. A typical example is using it to identify which products are more likely to be purchased together.
Association rule mining is usually used to support cross-selling. This is when companies offer the customer extra products they might have forgotten or don't know about yet. As an example, if you are buying a new guitar and an amplifier, you might also want to buy a cable or new strings.
This is done by algorithms that scan historic transactional information and look for the co-occurrence of items. It will generate a series of rules that model the likelihood of certain items being bought together. Two of the most important values generated by these algorithms are support and confidence.
- Support is the ratio of transactions that include the specific set of items against the total number of transactions. It tells you how frequently the set of items occur together. For example, if {guitar, amplifier, cable} have a support value of 2%, it means that 2% of all purchases include all 3 items.
- Confidence is a measure of how likely it is that Z will be bought if we are already buying A. It is defined as the ratio between the transactions that include Z and A against all the ones that included A. A confidence of 30% between guitar and amplifier means that 30% of the customers who bought a guitar also bought an amplifier.
These algorithms can generate massive amounts of rules and not all of them are useful. Often, only rules with high values of support and confidence are allowed to stay, the rest are discarded.
Physical stores can use this information to group items together to promote purchases, and online stores can offer you items at checkout-time and even provide some discounts for specific items. It is known that demographical information about customers increases the effectiveness of these algorithms, so most shops offer loyalty cards with discounts in exchange for your data.
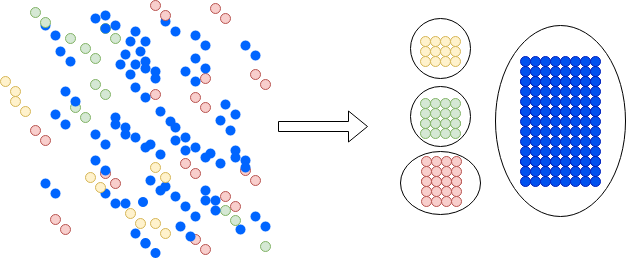
2. Segmentation
Segmentation is one of the most useful data science techniques. It aims to group the elements of a dataset into subgroups that have characteristics in common. While the task is not that difficult in a 2d plane, sets with lots of attributes make it impossible for a human to accomplish this task. By leveraging data science you can find some useful and counterintuitive groups in data.
Segmentation can dramatically improve the effectiveness of marketing campaigns. Instead of sending the same campaign to everyone, you could create segments of users and target them with only the information they need. You can even create specialized campaigns aimed at different subgroups. This has two upsides: first, you don't bother people with offerings they don't care about. Second, it lets you save money and increase the success of campaigns by focusing the resources were you have the most chances to succeed.
Machines are much better at uncovering unknown subsets in data than humans are. After they have created segments, a human expert can inspect the set to ensure they make sense.
This technique transcends beyond marketing and has a wide array of applications, ranging from identifying gene sequences to patterns in population groups, ecosystems and documents.
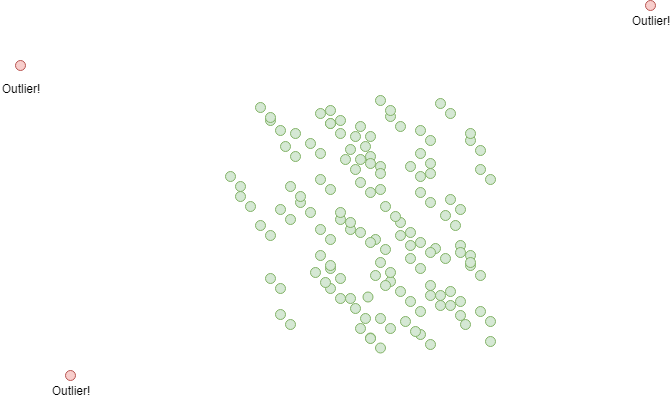
3. Outlier detection
Outlier detection is in some way the opposite of segmentation. In segmentation, you want to create groups containing only similar elements, in outlier detection you want to separate the instances that are different from the rest. The goal of outlier detection is to find anomalies or special cases within our dataset.
This can be achieved in 3 ways:
- Create two big clusters of data using segmentation. Typical cases will be grouped together and outliers will be the elements out of the group.
- Measure the distance between each element and the center of the data. Anomalies will usually be the ones farther away from the group.
- Train a classification model to divide instances into two groups. This is difficult because you need (as you remember) training data for the classifier, and outliers are by definition rare, representing just a small portion of the training set. This affects the performance of many types of classifiers.
Outlier detection is used by financial institutions to identify fraudulent transactions or other forms of fraudulent behavior. It can also be used to detect malicious network activity or attacks on software systems.
Unlabeled data is powerful
Unsupervised learning is a very powerful idea with lots of applications. Part of this power derives from being able to make use of the most common type of data available: unlabeled examples. We explored 3 common applications, but it doesn't mean those are the only things you can do with unsupervised learning. It's also possible to build classification and regression models!
For building a classifier, you could use a clustering algorithm (like k-means clustering) to discover natural segments in your data. After that, you could compute the distance between a new example and the centroids (among many other possibilities) to classify it in any of the clusters. Using a similar idea you can build a regression model: you could calculate the similarity between a new example and a specific number of data points in your data. After finding the data points with the most similarities with your new example, you can use their aggregated attributes to extrapolate the target value of the new example.
You can also use supervised learning to assist the process of creating a new data solution. A common first task when dealing with machine learning problems is using clustering and outlier detection to discover underlying patterns or clean your datasets from noise.
No matter what you choose, becoming familiar with this set of techniques and ideas will be very useful in your career as a data scientist.
Thank you for reading!
What to do next
- Share this article with friends and colleagues. Thank you for helping me reach people who might find this information useful.
- This article is based on Data Science for Business: What You Need to Know about Data Mining and Data-Analytic Thinking. This and other very helpful books can be found in the recommended reading list.
- Send me an email with questions, comments or suggestions (it's in the About Me page)