Selecting the right metric plays a huge role in evaluating the performance of a model. It can sound a bit exaggerated, but your project's chances of succeeding depend in great part on choosing a good performance measure. Making the wrong choice can result in models that are a poor fit for the task you are trying to solve.
Precision and recall are two basic concepts you need to understand when evaluating the performance of classifiers. Accuracy is also a very popular choice, but in many situations, it might not be the best thing to measure.
Let's find out why.
How accurate is your classifier?
Suppose you are building a classifier for categorizing photos of hand-written numbers from 0 to 9. Your training set has the following distribution, balanced to include an equal amount of every class:
- 10% of the training set are images of 0
- 10% of the training set are images of 1
- 10% of the training set are images of 2
- 10% of the training set are images of 3
- 10% of the training set are images of 4
- 10% of the training set are images of 5
- 10% of the training set are images of 6
- 10% of the training set are images of 7
- 10% of the training set are images of 8
- 10% of the training set are images of 9
You build a first classifier whose goal is just to detect if the image is a 1 or any other number (a binary classifier). As always, you set aside your validation and tests sets and train the classifier. In the next stage, you measure the accuracy of the model and get as a result an accuracy of 87 %, but is it good?
Well, not really. Imagine you have a naive model that classifies every photo as Not 1. With the distribution of our examples, it will correctly classify 90% of the examples, even better accuracy than our trained model!
Why did this happen? Well, for starters, our data is not balanced. Only 10% of the examples belong to the positive class (It's 1) while the remaining 90% belongs to the not 1 class. In real life you might not have access to balanced data sets, so you need a better measure for performance than simple accuracy.
On the positivity of the positive class
It's important to clarify that the positive in positive class doesn't mean good class. Generally, we label as positive the result of interest in our domain, independently of the nature of the result itself.
For example, in an application where we want to detect cancerous tissue the images with cancerous cells are part of the positive class and the healthy ones are in the negative class.
For an application that detects fraud (you guessed it) fraudulent transactions are members of the positive class and normal transactions are members of the negative class.
Generally, positive class means class of interest, independently of the application.
Introducing the confusion matrix
Binary classifiers can perform 4 different actions:
- Correctly classifying a member of class A (the positive class) as A.
- Correctly classifying a member of class B (the negative class) as B.
- Incorrectly classifying a member of class B as A.
- Incorrectly classifying a member of class A as B.
You can express the total number of occurrences of each scenario using true and false positives/negatives.
Let's define what these are:
- True positive: Are instances of the positive class that were correctly classified in the positive class. In our example, it would be a photo of a 1 correctly classified as 1.
- True negative: Are instances of the negative class that were correctly classified in the negative class. In our example, it would be a photo of any number other than 1 correctly classified as a not 1
- False positive: Are instances of the negative class incorrectly classified in the positive class. In our example, it would be a photo of a number other than 1, like an 8, incorrectly classified as 1.
- False negative: Are instances of the positive class incorrectly classified in the negative class. In our example, it would be a photo of a 1 incorrectly classified as Not 1.
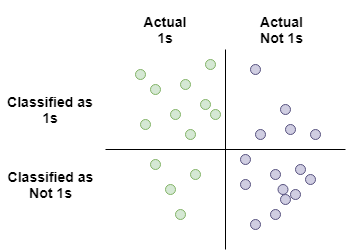
You can run your model on the validation (or test) set and count how many true positives/negatives and false positives/negatives you got. A convenient way to visualize the performance of a classifier is by aligning the results in graphical form:

Let's analyze quadrant by quadrant what this means:
-
Upper left quadrant: This quadrant has all the instances of 1 (the positive class) that were correctly classified as 1. This is the quadrant of true positives
-
Upper right quadrant: This quadrant has all the instances of Not 1 that were incorrectly classified as 1. This is the quadrant of the false positives.
-
Lower left quadrant: This quadrant has all the instances of 1 that were incorrectly classified as Not 1. This is the quadrant of the false negatives.
-
Lower right quadrant: This quadrant has all the instances of Not 1 that were correctly classified as Not 1. This is the quadrant of true negatives
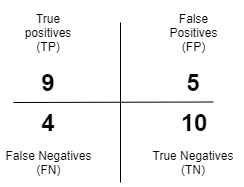
You can count how many instances fall in each category and summarize it in a table called confusion matrix. The following is a confusion matrix based on the results obtained by our hypothetical classifier:

Now that you understand what are true/false positives/negatives and what is a confusion matrix we are ready to define precision and recall.
Precission and recall
Precision and recall are pretty useful metrics.
Precision is defined as the ratio between all the instances that were correctly classified in the positive class against the total number of instances classified in the positive class. In other words, it's the percentage of the instances classified in the positive class that is actually right.
The equation for precision is:

Let's make a brief analysis of this equation to understand it better.
True Positives are all the instances that were correctly classified as positive, now we need to divide it by the total number of instances that were classified as positive. If you look at the previous images, you can see that the total number of instances classified as positive is given by the sum of the true positives and false positives.
We can use the confusion matrix to calculate the precision value for our classifier: 9/14
In a practical sense, precision tells you how much you can trust your classifier when it tells you an instance belongs to the positive class. A high precision value means there were very few false positives and the classifier is very strict in the criteria for classifying something as positive.
Now let's take a look at recall.
Recall is defined as the ratio between all the instances that were correctly classified in the positive class against the total number of actual members of the positive class. In other words, it tells you how many of the total numbers of positive instances were correctly classified.
The equation for recall is:

Let's make another brief analysis of the equation to understand it better.
True Positives are all the classes that were correctly classified as positive, now we need to divide it by the total number of actual members of the positive class. If you look at the previous images, you can see that the total of number members of the positive class is given by the sum of the true positives and false negatives.
We can use the confusion matrix to calculate the recall value for our classifier: 9/13
In a practical sense, precision tells you how much you can trust your classifier to find all the members of the positive class. A high recall value means there were very few false negatives and that the classifier is more permissive in the criteria for classifying something as positive.
The precision/recall tradeoff
Having very high values of precision and recall is very difficult in practice and often you need to choose which one is more important for your application. Usually, increasing the value of precision decreases the value of recall, and vice-versa.
Briefly, precision and recall are:
- Precision: Returns mostly positive instances.
- Recall: Finds as many positive instances as possible.
The easiest mental model I've found for understanding this tradeoff is imagining how strict the classifier is. If the classifier is very strict in its criteria to put an instance in the positive class, you can expect a high value in precision: it will filter out a lot of false positives. At the same time, some members of the positives class will be classified as negatives (false negatives), something that will reduce the recall.
If the classifier is very permissive it will find as many instances in the positive class as possible, but this also means that you run the risk of misclassifying instances of the negative class as positive. This will give you a good recall (you correctly classified almost every positive instance) but it will reduce the precision (there will be more members of the negative class classified as positive).
For an extreme example imagine a naive model that classifies everything in the positive class. This classifier will have a recall value of 1 (it found every positive instance and classified it correctly), but also an abysmal precision value (lots of false positives).
In practice, you need to understand which metric is more important for your problem and optimize your model accordingly. As a rule of thumb, if missing positive instances is unacceptable you want to have a high recall. If what you want is more confidence in your true positives then optimize for precision.
Cancer diagnosis is an example where false positives are more acceptable than false negatives. It's ok if you misclassify healthy people as members of the positive class (has cancer). Missing a person who needs treatment, on the other hand, is something you don't want. In this type of problem you want very high recall values: find as many members of the positive class as possible.
The opposite scenario is spam classification, where false negatives are much more tolerable than false positives. It doesn't matter if you occasionally find a spam email in your inbox, but having good emails classified as spam can be problematic. This scenario favors precision over recall.
Choose the right metric
If your data is balanced, accuracy is usually a good metric to get an idea of your classifier's performance.
When your data is not balanced or the relative risk of having false positives/false negatives is important, you need special metrics. Precision and recall are two popular choices used widely in different classification tasks, so a basic understanding of these concepts is important for every data scientist.
These, of course, are not the only methods used for evaluating the performance of a classifier. Other metrics like F1 score and ROC AUC also enjoy widespread use, and they build on top of the concepts you just learned.
Now you will be in a much better shape to continue your journey towards mastery in data science.
Thank you for reading!
What to do next
- Share this article with friends and colleagues. Thank you for helping me reach people who might find this information useful.
- This article is based on Data Science for Business: What You Need to Know about Data Mining and Data-Analytic Thinking. This and other very helpful books can be found in the recommended reading list.
- Send me an email with questions, comments or suggestions (it's in the About Me page)


